The dashboard will be enabled to support server administration and monitoring.
CAS 5 provides about two dozen endpoints under the ${cas.server.prefix}/status/ URL that allow administrators, permissions granting, to obtain real-time configuration data and performance monitoring statistics, and also make configuration changes. It also provides a rudimentary dashboard interface through which these endpoints can be accessed, as shown in Figure 21.
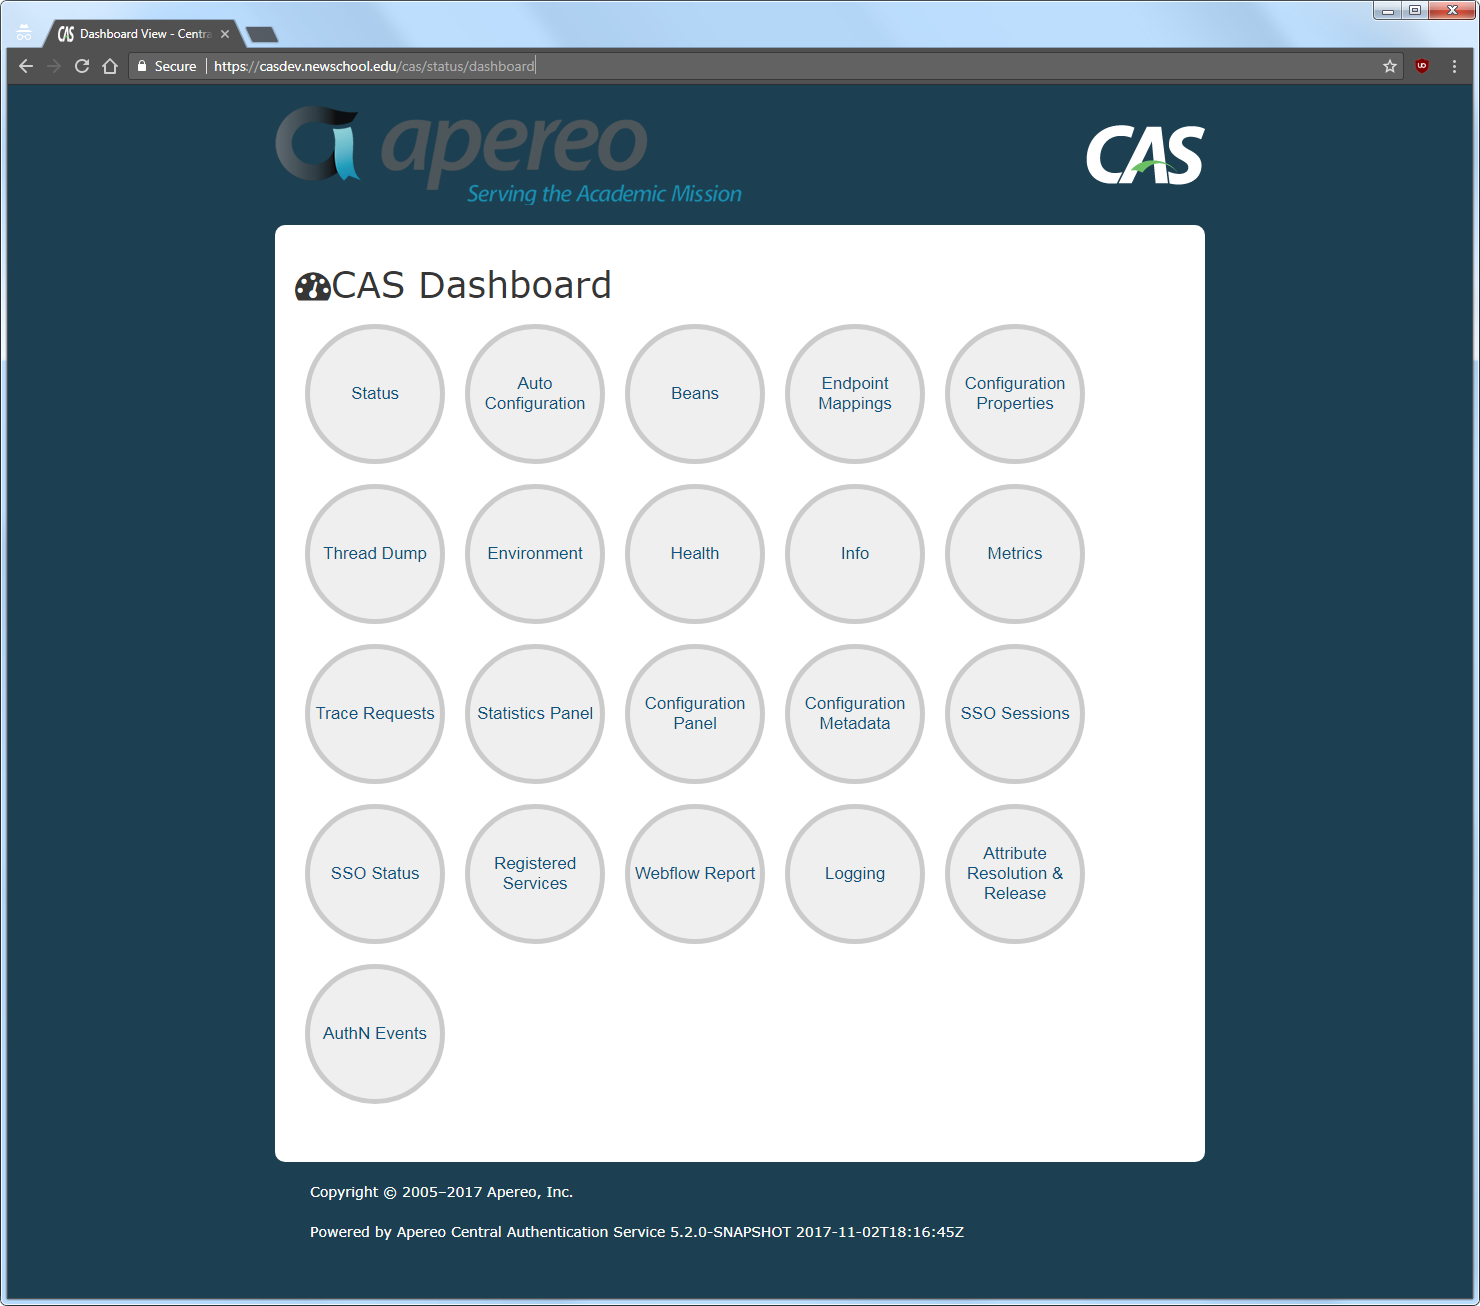
Some of the more “interesting” endpoints include:
- Status – A quick text-only summary of the server’s health, number of sessions, memory usage, host name, server name, and CAS version.
- Configuration Properties – A JSON-formatted dump of all the CAS configuration properties and their current values.
- Statistics Panel – A dashbnoard-like display of expired and unexpired tickets, JVM statistics, and other information.
- SSO Sessions – A dashboard-like display of current active sessions, including usernames, tickets, authentication times, etc.
- Registered Services – A JSON-formatted dump of the service registry (the management webapp will provide a better representation of this information).
- Attribute Resolution and Release – An interactive interface to test attribute resolution for individual users, and attribute release to specific services.
As of this writing, most of the endpoints don’t do anything beyond print information in raw JSON format. However, even this can be useful for examining the current server state, although it may require copying-and-pasting the output into a JSON pretty-printer (such as Code Beautify) to make any sense of it.